Showing posts with label stock. Show all posts

Saturday, 12 March 2011

Stock Market Cycles


Hello
Even during raging bull markets and the hottest stocks in play they always go through 6-20 week cycles. Everyone thinks even the strongest stocks in the best bull markets go straight up. But that’s not the truth. The stock always goes in cycles of about 6-20 weeks. This is why so many get caught out. They jump in too late and get out too late. You have to get in at the right time of the cycle and simply try to ride it out. We are already 7 weeks into this cycle so you really should be in your positions by now.
See the charts.
Momentum stocks we are in are about to get in:
CREE
MEE
CAAS
JOYG
X
GMCR
NTAP
BUCY

The basic of short selling in stock market

What is short-selling?
Short-selling is the sale of shares that the seller does not own at the time of trading. Despite being a long-standing market practice worldwide, short-sales have been the subject of considerable debate and divergent views in most securities markets.
The first thought popping up in your mind would be – where do these shares come from which you are selling without possessing them in your portfolio of stocks. These come from your broker/brokerage firm that lends you the shares in lieu of your investment as collateral. You short sell these shares but subsequently you have to close the short by buying back the shares from market and then return it to your broker/brokerage firm. You are also charged some interest for the loan of shares you have taken.
shortselling
Looking at the flow of shares in above flowchart, one would ponder why to borrow shares for selling in market and then transfer them back to the lender? The logic behind shorting is very simple; earning profit margin. Let’s see how??

If you think a stock is overvalued and expect that the price would come down in future for sure; you would wish to sell the shares at current levels at higher price. So you borrow the shares and sell them at higher price. And when the stock actually falls as you had speculated; you buy it from market at lower price and return it to the lender and the difference between the selling price (higher) and buy price (lower) is what you earned in the deal. So at the end you must close the short by paying back the shares and this is called as “covering the short”.Concluding this, investors who anticipate fall in the stock price go short to take advantage of market fall. An investor can hold the short for as long as he wants but he is charged an interest as it is similar to a loan taken in the form of shares. Also if during the course of loan, the company declares dividend or rights issue, it must be paid to the lender who is the actual owner of shares because you are just a borrower.
Short selling is considered to destabilize markets directly or indirectly. In 2001, the stock prices crashed heavily owing to short selling by big operators after which SEBI banned it. After a gap of 6 years in December 2007 SEBI came up with updated norms of short selling to cover the loopholes and ultimately institutional investor were also permitted to short sell.
Concluding this, short selling no doubt gives you an opportunity to earn profit by taking advantage of downturn of markets, it might bring in huge loss to your investment if stock price moves up. Because in real sense, shorting is a bet against the current market trend. When stock is at current higher levels, you are expecting it to fall down and entering the arena. Speculation is what makes shorting a riskier job. So beware of the dark side of shorting before you actually go for it!

Stock Market Technical Analysis

In finance, technical analysis is a security analysis discipline for forecasting the future direction of prices through the study of past market data, primarily price and volume.

More and more new investors are coming to the market by diving into trading mainly focusing on technical analysis without paying attentions to the fundamentals. This is not a bad thing and I do not want to state that all of them are wrong. However, I consider that before starting stock market trading based on the trading signals generated by technical analysis results, the one should know what he/she can expect from the technical analysis.

First of all, technical analysis is not an exact since and none of technical indicators would guarantee that chosen trading vehicle will perform in desirable manner.
If you decided to use technical analysis as a foundation of your trading you should know that this is not an easy task to analyze the stock market. If it would be easy then everyone would be a winner. If somebody made $10,000 on the market that mean that somebody (or several traders) lost those $10,000. Only in pyramid business and bubble market number of winners exceeds the number of losers. Yet, you know what happened after - pyramids and bubbles always, sooner or later, collapse and in the end winning/losing balance is restored. The art of technical analysis is to be better than the other general population of traders.

If you just came to the market you should not expect that technical analysis or some magic technical indicator will make you rich in short period of time. As a rule those who came to the stock market with the purpose of become rich fast end up with empty pockets. If you have this idea in your head, then you are a gambler and it is better for you and for your budged if you go to a Las Vegas - at least there you will have more chances to win.

No matter how professional you feel in technical analysis, if you are novice trader be prepared to lose everything you decided to allocate for trading. If you have never traded before, it is a bad idea to take all your savings into your trading. If you only starting a trading use the same principle majority of smart people use when they go to Las Vegas - dedicate for trading the amount of money that you are not afraid to lose. Prepare yourself to the fact that most likely you will lose them. As a rule when people may take for instance $1000 with a thought that they are going to have just fun and most likely they will lose this money in exchange for fun. If you go to Las Vegas with other purpose then you are a gambler and you should stay home.

The same is when you do the first step on the stock market. Take $1000 or more (whatever you are not afraid to lose) with a thought that most likely you will lose these money, yet in exchange you will gain an experience and knowledge of trading. You will find out what a trader feels when he/she in the losing position, what does greedy buying and panic selling mean, why a trader expects to the last moment that the market may reverse in his/her favor, how once profitable position can became a loss because of greed, etc. If after that you are still confident that you want to go into real trading battle and you understand that technical analysis is not as easy and simple as it looks like, then welcome to the real world of hard work.

How to buy stocks for dividends

Investing in stocks that pay dividends is one of the best financial decisions an investor can make. These investments not only provide an opportunity to increase net worth from rising share prices, they also can help supplement an investors income for many years. As long as an investor is diligent about selecting these investment choices, there is little associated risk over the long term. Stock Dividents can be attractive as a source of steady income, while you still get to retain the stock shares for further returns. There is also a perception that companies which can afford to pay dividends are generally more stable.

Finding the best stocks that pay dividends requires research and patience. Anyone can simply invest in the highest yielding securities blindly based only on the current payout. That investment strategy, however, will eventually cost the investor a lot of lost earnings and time. Searching for the best quality companies is a safer and more stable option for the long term investor. So how can an investor find the best dividend paying stocks?3 Ways to Find Stocks that Pay Dividends

Here are 3 popular strategies for identifying quality stocks that pay dividends.

List of Dividend Paying Stocks -
There are many organizations that publish lists of dividend paying stocks that offer some good investment ideas. For example, the S&P 500 Dividend Aristocrat list is published once per year which contains stocks with a strong history of dividend increases. A company must have raised their annual dividend distribution consistently for at least 25 years.

Stock Screen -
The best dividend stocks can be filtered out by identifying a set of criteria to look for. Most online discount brokers and financial websites offer stock screen tools that can be used to narrow down the search for stocks that pay dividends. Income investors typically set their criteria using data like dividend yield, dividend payout ratio, P/E ratio, etc.

Financial Websites and Blogs -
There are plenty of places to look for dividend paying stocks on the internet. The blogging community offers several different options and analysis which can help investors identify potential opportunities. Just remember that most of these sites offer biased opinions on investments, so due diligence is required.

Final Thoughts
There are many investment choices when it comes to stocks that pay dividends. Some of these stock choices make for very poor investments. On the other hand, there are plenty of blue chip dividend stocks that are safe and secure and can be wonderful investments. Filtering out the poorly run companies from the best dividend paying stocks can be difficult, but is necessary for long term success.

Plan before investing in stock

Since there are risks in investing in most cases, you need to have an investment strategy prepared before you get your money to work for you. It is like a game where you won't know the outcome for sure until it has been decided and most of the time you need a winning strategy. Much like in investing, you will need a winning strategy to be successful.

Having a plan on how to invest your money in various investment vehicles serves as your strategy. You investment strategy will help you achieve your financial goal in time. You must choose from a number of investments from different investment vehicles. The stock market has as one of those investment types have numerous type of stocks from various companies which you can choose to put your money in.

It can become very confusing and difficult if you don't have enough knowledge and haven't yet learn enough since there are so many investment types to choose from. The investment strategy you will develop together with your investment style and risk tolerance should make all the confusion and difficulties be at minimum. If you are new to investing in general, working closely with a good financial planner should be a great benefit to you before making any investment. They should be able to guide and help you create your investment strategy to achieve your financial goals all within the bounds of your risk tolerance and investment style.

It's a waste of time and money to invest without a strategy to reach a specific goal. It is important that you know where your money is going and what your money is doing before you give it away before you expect it to come back with some returns. Always have a plan and a goal before doing anything.

Plan before investing in stock

Since there are risks in investing in most cases, you need to have an investment strategy prepared before you get your money to work for you. It is like a game where you won't know the outcome for sure until it has been decided and most of the time you need a winning strategy. Much like in investing, you will need a winning strategy to be successful.

Having a plan on how to invest your money in various investment vehicles serves as your strategy. You investment strategy will help you achieve your financial goal in time. You must choose from a number of investments from different investment vehicles. The stock market has as one of those investment types have numerous type of stocks from various companies which you can choose to put your money in.

It can become very confusing and difficult if you don't have enough knowledge and haven't yet learn enough since there are so many investment types to choose from. The investment strategy you will develop together with your investment style and risk tolerance should make all the confusion and difficulties be at minimum. If you are new to investing in general, working closely with a good financial planner should be a great benefit to you before making any investment. They should be able to guide and help you create your investment strategy to achieve your financial goals all within the bounds of your risk tolerance and investment style.

It's a waste of time and money to invest without a strategy to reach a specific goal. It is important that you know where your money is going and what your money is doing before you give it away before you expect it to come back with some returns. Always have a plan and a goal before doing anything.

What does "Above The Market" means

Above the market refers to a strategy used in stock trading in which the investor makes trades only when the price of a security reaches a point somewhere higher than its current level. Both buy and sell orders may be made in this way. The three most common types of above the market orders are a buy stop order, a buy stop-limit order, and a sell limit order. Traders who use this strategy on buy orders are betting on the momentum of the price jump to continue to spur the price upward.

There are many strategies used to play the stock market, but most are variations of the buy-low, sell-high strategy that most investors quote as a motto. Except when it is used to sell stock, trading above the market flies in the face of this motto, as an investor who uses it to buy stock will be buying high. Investors using this strategy attempt to find a level where they can trust that the upward movement is a trend rather than a fluke.

One type of above the market order is a buy stop order. In this type of stock trade, an investor instructs his broker not to buy a stock until it reaches a certain price above where it currently stands. For example, if a stock is trading at $50 US Dollars (USD) per share, the investor may place a buy stop order at $60 USD per share. If the price reaches that level, then the investor makes the purchase. Should the stock fail to reach that level, then the investor does nothing.

A buy stop-limit order is an above the market order often used in conjunction with this. At times, an investor may want to ride the momentum of a stock only so far, fearing that at some point the stock may level out and cause the price to fall. Using the example above, the investor may put the buy order at $60 USD per share but put a limit at $65 USD per share. That means that the buy order will be in effect at $60 USD per share but will be canceled once the price reaches $65 USD per share.

The sell limit above the market order falls in line with the typical stock strategy that holds that investors should sell stocks at a high price. A limit order means that the order is not executed until a certain level is reached, which differs from a market order, which is executed immediately. An investor holding shares of a stock at $25 USD per share may put a sell limit order on the stock once it reaches $35 USD per share. At the point when the stock reaches that price, the investor will sell the shares.

How Can I Make Money In The Stock Market

Stock market investors hope to make money. Who wouldn't? That's why this question comes up so frequently! Below I'll share a strong tip with you, on how you can earn a profit as an investor.
It's great when your investments pay off. To be in control of your economic future by choosing the wisest investments. It's a high I truly love!
Even though it's not effortless, it is possible to make a profit from stock investments, if you decide on a few wise moves.
Let's looks at your safest bet for profitable stock market investments. If you know how many hours you can take for your investment efforts, it's not too difficult to earn a profit.
You say all you can spare are a couple of hours every week for your stock market investments? It costs you money when you don't select your investment strategy according to your schedule.
If your free time is severely limited, then day-trading won't be an option. If you don't keep an eye on what the market does, you can't position your investments to your best advantage. I have seen myriad people try to day-trade without allowing enough time and it usually costs them a lot of money!
Day trading isn't the only way to invest for profit! Even if you have just a little time to spend, there are ways to invest your funds wisely and earn extra cash.
It's my contention that daily monitoring and positioning isn't necessarily the best investment tactic. A lot of people would be better off with something less demanding of their time. By this I am not saying months or even years choose positions and then quit them in a few days if you decide to change. Having on a position that doesn't make you worry through the day is sufficient.
All you have to plan for is regularly scheduled time you can use for your investment style. You can schedule this every day, week, even less. This is time to analyze the market and make selections of stocks based on current economic events and the future outlook. If you apply a bit of your time, you will always find profitable investments.
Another investment style would be to specialize in just one field. This might mean that you just focus on annuities. Or maybe you would rather focus on a certain industry. Whatever may be the case, when you usually have limited time, I suggest you focus on finding a specialty that suits you and that you find interesting.
When you select your investment strategy, make sure you the pick one that's designed for your needs! Keep in mind that your strategy can only be effective if you can invest the necessary time. If you customize your investment style and change it as your circumstance dictates, you are in the most powerful position for maximum profit potential.

The Basics of Stock Trading

Stock trading is actually a misnomer as stocks are not actually traded during the buying and selling process. This phrase is simply jargon used by those in the industry to indicate the buying or selling of various stocks. Stocks are typically a subject that creates much confusion for inexperienced investors and sometimes even for those that are more seasoned.
It is always advisable that individuals interested in buying or selling stocks obtain professional assistance, from reputable companies in the industry such as Firstrade. Having professional guidance and advice from someone adept in stock market processes will help ensure the buying and selling of stocks goes smoothly without unnecessary complications. The following information will provide some basic insight into stocks and how they are traded.
The Various Types of Stock
When individuals enter into the foray of stock trading, they will be met with terms with which they may be unfamiliar. Learning these terms will help investors to better understand the process and be better equipped to make profitable decisions regarding their stocks.
Common vs. Preferred Stock
Common stock is the form in which the majority of stocks are issued. Through capital growth, common stocks typically yield greater returns than almost any other type of investment. However, these types of stock also present a higher risk to investors. With common stock, investors have one vote per share in regard to the election of board members.
While preferred stock may not offer the same type of voting privileges, this type of stock does represent a degree of ownership in the company. Preferred stock presents less risk to investors as it usually guarantees a fixed dividend for an unspecified amount of time. However, preferred stock can be callable, which means the company has the right to purchase the stock from the stockholders at any time and for any reason they choose.
Listed and OTC Stock
Companies whose stocks are traded on the New York Stock Exchange (NYSE) are considered listed securities or stocks. NYSE listing requirements ensure that these stocks conform to certain criteria such as market capitalization, revenue, and number of shareholders. These listing requirements are in place in order to ensure and enforce stability. Anytime a stock fails to meet the listing requirements, it can be delisted. It will be important for investors to ascertain whether their stock is considered listed with member firms. Member firms are those companies that regularly conduct stock trades on the NYSE.
Over-the-counter (OTC) stocks are also referred to as off-exchange trading. Unlike listed stocks, OTC stocks are traded directly between two parties. Even though OTC stocks are not listed or traded on the stock exchange like other stocks, they must still meet regulations and requirements established by the U.S. Securities and Exchange Commission (SEC). However, some OTC stocks do not have reporting requirements. Examples of OTC stocks with no reporting requirements are those stocks that are considered Pink Sheets securities.
Penny Stocks and Large Cap Stocks
Penny stocks are another type of security. They are sometimes referred to as a micro cap equity. When the shares of a company trade for $5.00 or less, these are known as penny stocks. While penny stocks are more volatile and present more risk to investors, they require less initial investment which makes their acquisition easier. The companies from which penny stocks may be purchased are often less secure and may not pay dividends. However, penny stocks may potentially have a higher payoff in a shorter period of time.
Large cap stocks are on the other end of the spectrum from penny stocks. Large cap stock is a term used to refer to those companies that have a market capitalization value of more than $10 billion. Stocks may also be referred to as medium, small, or micro, as discussed previously. The market capitalization value of a company will be determined by multiplying the company's number of outstanding shares by the price per share of its stock.
Professional Assistance with Stock Trading
When individuals desire to trade stock, it will typically be in their best interests to seek advice from a professional. Being well-versed in stock and other market terms will help potential investors ensure they have a comprehensive understanding of the investment they are making. As with anything with which individuals are unfamiliar, expert counsel from investment firms, such as Firstrade, is highly recommended. Before making any decisions regarding the buying or selling of stocks, professional assistance should be sought.
Danielle Taylor writes out of New York about different investing options and stock brokers such as Firstrade. Always looking reputable financial guidance, she tends to end up planning her finances at http://www.firstrade.com more often than not.

Trade on Mumbai Stock Exchange

BSE, or other stock exchanges for that matter, are hold significant amount of importance. There is hardly any financial news in the country can be complete sans capital market related news. In fact, most of the people are aware of only BSE and National Stock Exchange whenever the mention of India's capital market comes up.
Bombay Stock Exchange, as mentioned in the name itself, is situated in Mumbai, India. The stock exchange is one of the oldest and the most important exchanges in India. Bombay Stock Exchange, popularly by its short form BSE, was established during the 1850s which involved a group of various stockbrokers congregating under a tree for buying and selling shares. However in the present day, the exchange is located in the Phiroze Jeejeebhoy Towers at Dalal Street in Mumbai. BSE has currently over 5000 listed organizations and is biggest with respect to market capitalization.
To be more specific, during 1850s, one parsi and four Gujarati stockbrokers used to assemble under banyan tree for share trading. They were gradually joined by many more brokers due to which the meeting place had to be changed at times. However, the meeting place was made permanent in Dalal Street in the year 1874. By the year 1875, this was given an official structure under 'The Native Share & Stock Brokers Association'.
Sensex, short of Sensational Index, is an index used by BSE that is actually a value-weighted index. Sensex is a basket of 30 major stocks that represent well established and leading companies throughout critical sectors.
In order to get listed on Mumbai Stock Exchange, an organization has to fulfill some of the criteria, which includes listing of the company in-question at least three months prior on BSE. Other conditions include trading of the company's stock on a daily basis in the preceding 3 months on the exchange, and excellent track record of the company. Other than that, the company has to be counted among the top 75 organizations in terms of market capitalization.
After this, the organizations are sorted as per the absolute turnover, following which they are sorted as per their cumulative turnover. Stocks currently listed on the BSE Sensex include Tata Consultancy Services, NTPC, Maruti Suzuki, Reliance Communication, State Bank of India, ICICI Bank, Hindustan Lever, among others.
Other indices in the Mumbai Stock Exchange include Smallcap Index and Midcap Index. Sectoral indices are also present, such as IT, Power, Technology Media & Telecom, Oil and Gas, Metal, Healthcare, PSU, Banking, Consumer Durable, Capital Goods, Auto, Real Estate and FMCG Index.
BSE, or other stock exchanges for that matter, are hold significant amount of importance. There is hardly any financial news in the country can be complete sans capital market related news. In fact, most of the people are aware of only BSE and National Stock Exchange whenever the mention of India's capital market comes up.
Resource: Stockexchange9.in fills you up with all the information about and around Bombay stock exchange. The site will helps you open demat account with the best broker and avail best brokerage deals.

Future potential shares can be divided into several groups

Ordinary shares purchasers typically invest their funds into the company-issuer and become its owners. Their weight in the process of making decisions in the company depends on the number of shares he/she possesses. Due to the financial experience of the company, its part in the market and future potential shares can be divided into several groups.
1. Blue Chips
Shares of large companies with a long record of profit growth, annual return over $4 billion, large capitalization and constancy in paying-off dividends are referred to as blue chips.
2. Growth Stocks
Shares of such company grow faster; its managers typically pursue the policy of reinvestment of revenue into further development and modernization of the company. These companies rarely pay dividends and in case they do the dividends are minimal as compared with other companies.
3. Income Stocks
Income stocks are the stocks of companies with high and stable earnings that pay high dividends to the shareholders. The shares of such companies usually use mutual funds in the plans for middle-aged and elderly people.
4. Defensive Stocks
These are the stocks whose prices stay stable when the market declines, do well during recessions and are able to minimize risks. They perform perfect when the market turns sour and are in requisition during economic boom.
These categories are widely spread in mutual funds, thus for better understanding investment process it is useful to keep in mind this division.
You probably have been told that options are risky. Even worse, that you can lose your shirt trading them!
Well, what is the truth?
Let's take a look at stock ownership. What can happen if you buy stock?
The price can go up.
The price can go down.
The price can go sideways.
In the first case, you can make money. In the second you lose money.
And in the third case you don't directly win or lose but in fact it costs you money in two ways. The direct cost of brokerage and fees. And the indirect cost known as opportunity cost.
This is the cost due to lost opportunities. The fact that you aren't able to be involved in other, potentially profitable trades.
So if you purchase stock you can only make money if the stock price goes up.
Now some of you may be thinking, "But what about shorting?"
Well yes, short selling stock is possible but it is quite a tricky strategy and has almost unlimited risk so it is certainly not an approach we recommend.
You see, when you short a stock, you actually sell a stock that you don't own. And your intention is to then buy the stock back at a lower price. The price difference is your profit per share.
But can you see what the problem is here?
Well what happens if the stock price goes up? Particularly if it goes up a lot?
As you have sold the stock at a lower price you now have to buy it back at a higher price. And so your loss can be substantial.
So, to summarize, when you trade stock you can really only make money if the price increases.
Now there is one other aspect to this that I want to address. And this is that owning stock is expensive!
So don't just accept the common view that owning stock is safe and trading options is dangerous.
If you understand options and learn how to trade them they can be a great investment vehicle.

Recently Published Articles

America's jobless recovery Where are the jobs?

ALMOST everywhere you look, the American recovery seems to be picking up pace. The economy grew faster in the third quarter than originally reported. Industrial production continues to grow. Spending has been surprisingly strong, and the latest figures on pending home sales suggest that even housing markets may be stirring from their deep slump. The growth seems to be everywhere except the place it matters most—labour markets. Employment in America turned in a surprisingly poor performance in November, indicating that recovery still hasn't gotten the job creation machine turning steadily.
This morning, the Bureau of Labour Statistics reported a disappointing gain of only 39,000 jobs for the month of November. The figure came in well below expectations. In October, the economy grew by an (upwardly revised) 172,000 jobs, and on Wednesday a private employment report estimated that the economy added 93,000 private sector workers. Markets had expected one of the strongest reports of the recovery so far. That's not what they received.
In November, according to the BLS, private employers added just 50,000 new jobs—the worst performance since April. From that paltry total were subtracted 11,000 in lost government jobs. Small gains in federal and state government employment were offset by a 14,000 job fall in local government employment. Within the private sector, drops in employment among goods-producing and retail trade firms were offset by new hires among professional and businesses services and in the health and education sectors.
The unemployment rate rose to 9.8%—its highest level since April and close to the 10.1% recession peak. At 15.1m, the number of unemployed workers rose back to its April high (though some of this increase was due to new entrants to the labour force). Fully 6.3m people have been out of work for more than 27 weeks. Many of these workers are now cycling off federal emergency unemployment benefits, which expired November 30. Congress has yet to reauthorise the emergency benefits package, as it has done so many times through the recession. Some 2m jobless workers may lose benefits by the end of 2010, and perhaps 4m or more will lose them by April.
There is little to be happy about in this report, in other words. But there are some indications that the November numbers may be an aberration. September's job losses were revised down to 24,000 in this report, while October's job gains were revised upward, from 151,000 to 172,000. Through November, weekly data on initial jobless claims showed significant improvement. And of course, many other indicators have been flashing positive signs in recent weeks.
It's likely, then, that the November figures will be revised up in future months to show a better performance more in keeping with broader trends. And it's important to remember that monthly data are noisy. America's labour markets have yet to generate job growth sufficient to bring down the unemployment rate. But the pace of recovery has been improving. There is good reason to suspect that when all is said and done this report will appear as a blip marring a strengthening upward employment trend. All the same, policymakers in Washington weighing whether to extend unemployment benefits and tax cuts should heed the obvious weakness in labour markets. They can and should make sure that November's number remains an anomaly.

Trend Lines – Good Areas to buy Stocks


Trend Lines are good study tools to judge the price movement of a share over a period. A series and high and lows are identified by connecting them appropriately. The scheme for stop loss is ingrained in the chart showing the Trend Lines. With the cursory glance from the chart it is possible to know whether the stock market is trending higher or lower. While trend remains solid, with fewer swings, it denotes a rally and an investor can look for uptrend lines to establish new positions.
Technical analysts constantly watch the uptrend and downtrends to establish the reasons there for, and the factors contributing for particular type of swing in the market conditions. The resulting line, which is generally updated on daily basis, gives the trader a reasonably good idea about the direction of the movement of different shares in the portfolio of a client. This chart turns out to be a good tool, not only of the past history of the movement of the share, but also the possible indicator to make a successful trade.
Interpretation of Trend Lines

The data provided by the Trend Lines is unquestionable. It gives the clear picture whether the market forces are in your favor or not. When the Trend Lines are on the downward march, it indicates the excess supply of the shares and the investors are in a mood to sell the shares than show willingness to buy. That cautions an investor against the move to hold on to a long position. Gain in that context is unlikely when the long-term trends persist with the downward movement. This is the time for critical examination whether to hold on to the share or withdraw it from the portfolio. An uptrend suggests favorable conditions and an increased demand for the asset than the supply resulting in additional incremental value of the asset. Stop-loss orders are constantly watched by the traders as per the indicators in the Trend Lines. They are mostly moved higher as the Trend Line gears to slope upward. The trader sees an opportunity to lock in as much profit as is possible without withdrawing from the position too early. Relocate the stop loss order judging the possibilities of fluctuation levels. Ascending Trend Line is a good guide that is most likely to tender profitable trades.

Trend Lines help for entry and exit

With the picture before you about the overall direction of a given asset, the areas of support and resistance are identified. Trend Lines provide definite indications through the chart how the price of a share has problems in moving upward, which again is a pointer to the difficulty the particular company/industry might be facing. The entry and exit levels can be coolly decided with due respect to the clues provided by the Trend Lines. The relationship of the stop loss orders and the Trend Lines is also very intimate.
Trend Lines only impel and do not compel an investor to take the particular decision. It is an issue for the judgment of the concerned individual. The picture of the Trend Line in the chart may be a short term direction of the price of an asset. Several scenes are possible. The price may bounce to revert to the original level; it may continue to increase, it may remain constant in which case the Trend Line may move flat. This shows whether the trend is strengthening, weakening or remains constant.

Conclusion:

Trend Line is yet another technical signal which is in vogue in the stock trade. It is no substitute to the judgment of the trader; it is just an assisting tool. Common agreement about the interpretations of the data of the Trend Line between the two traders is unlikely. But the traders are aware of the strategic advantages Trend Lines provide for short term and long term trades. This is an invaluable permanent data available in the records of trader relating to shares and a good reference tool.

Thursday, 10 March 2011

CMA stock just recently

CMA stock just recently touched a new high at $60 dollars a share, with a dividend yield of around 3½ percent. In April of 2003 the stock was selling around $37.50 a share, paying a dividend yield of around 5% a year. Am I tempted to sell my position in CMA? Do I care if the stock drops from this lofty price back to $37 a share? Why should I? If the stock drops back to $37 a share, my dividends being reinvested back into the stock each quarter purchases more shares, and my dividend income from CMA simply and dramatically accelerates. I am also already prepared that if a buy-out offer is ever made for the company to reap the profits of owning the stock (as well as the possibility of another stock split).The second example is (unfortunately) in my book, also. I say unfortunately because my book is in the final copy edit stage, so no one has had a chance to read and benefit from it, and since a buy-out offer was made for the stock last week or so, the stock will no longer exist (this means a rewrite for me, before publication).
The company in question is the Rouse Co. (RSE), which was just purchased by General Growth Properties (GGP). Oddly enough, you'll find GGP in my book, also – if you bother to pick it up. Anyway, that's neither here nor there - RSE, on the takeover bid jumped over $16.00 a share in one day! Whew! Why couldn't they have waited a couple of months until my book was released? RSE had the opportunistic trait of raising their dividend every year since 1993 and I was quite content with its performance through the years.Well, that last paragraph blew my train of thought on this article. All I can think about at the moment is my rewrite.
I would like to take this time to explain something to you. I have never considered myself a writer nor am I a stock market professional. I am simply a man with 39 years of experience and a passion for the stock market, trying to share what wisdom those years have given me. When I sit down to write an article, I seldom have an idea on what I'm going to say. It was the same way when I sat down to write my book.

Triple Bottom Pattern

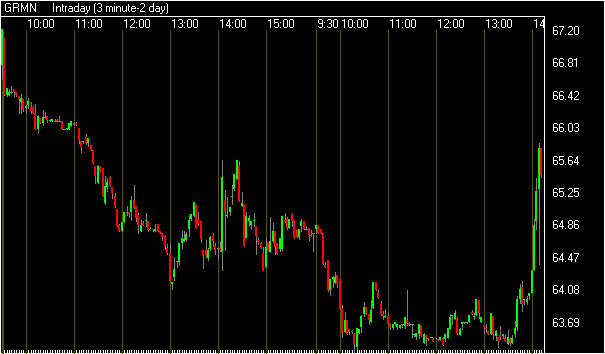
Chart patterns work the same on an intraday basis as they do on a daily chart. Today I was watching GRMN, which had been weak all day and was nearing the lows of the day. I actually was waiting for a breakdown to short sell the stock, but once the lows held, I noticed a familiar pattern – the triple bottom pattern. Immediately I bought the stock and set my stop loss for the low of the day. Momentum began to build as the shorts started to get squeezed, and I had quite a nice winner on my screen. While I didn’t catch the entire move up, I did catch a big piece of the move and it was great for my P&L.
Triple Bottom Triple bottom patterns aren’t just found on daily charts - they can also be found and traded on an intraday basis.
Be sure to apply well-known chart patterns to your day trading as well as your swing trading. Being a flexible trader with a willingness to change directions when your original thesis is proven wrong can pay off very nicely!